Home
Pyplan is an assisted Graphical Integrated Development Environment designed for easily creating and sharing Data Analytics Apps based on Python programming language.
Installing
You can install Pyplan on your desktop. Instructions for doing that can be found here. Or you can access it as a web application here.
Code Organization
The app code is structured using a hierarchical influence diagram of nodes -a Workflow- that helps understand the calculation logic. Nodes are added by means of a drag and drop user interface, and Python code is written inside their Code attribute tab.
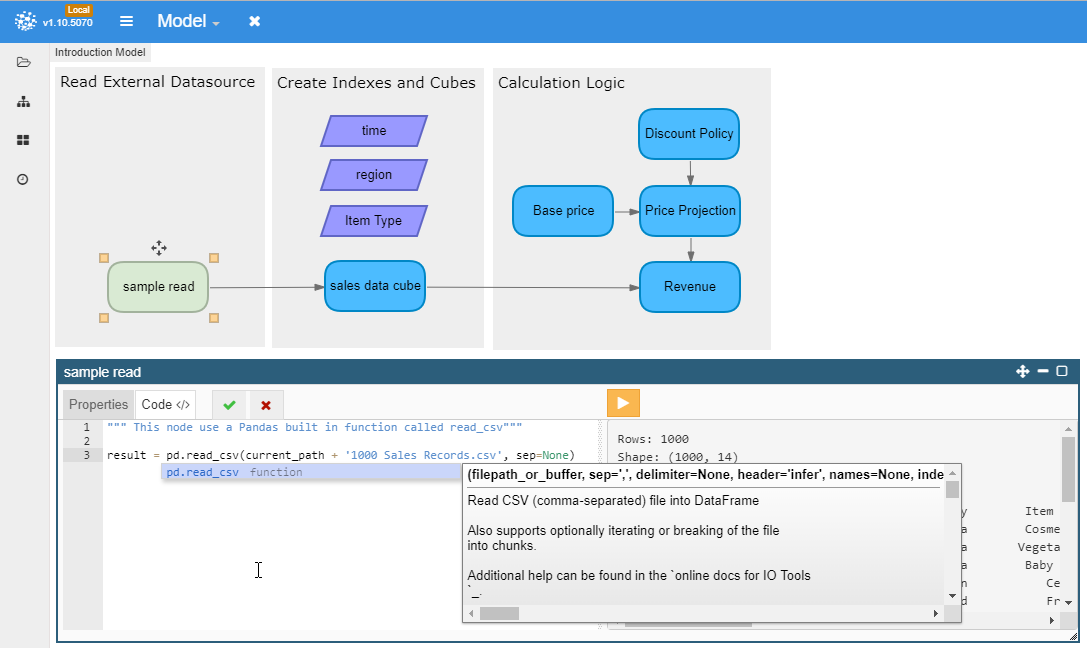
Nodes have several properties: Title, ID, Units, Inputs, and Outputs, which are displayed when a node is selected. The ID function allows to call the results from other nodes, and works as a global variable for programming.

Node Evaluation
Pyplan natively interprets Pandas, Numpy, and XArray data objects. Any node whose result is an object of these types can be evaluated (by double clicking the node) and visualized using native Pyplan charts and tables with no additional coding.

When a request to run a node is executed, all precedent nodes are calculated too, and their results are stored in memory, available for inspection and reuse. Pyplan engine keeps track of any change in a node that triggers recalculation downstream the calculation logic path.
Using Python Libraries
Any library from the extended Python developing community can be imported and used to meet specific needs.
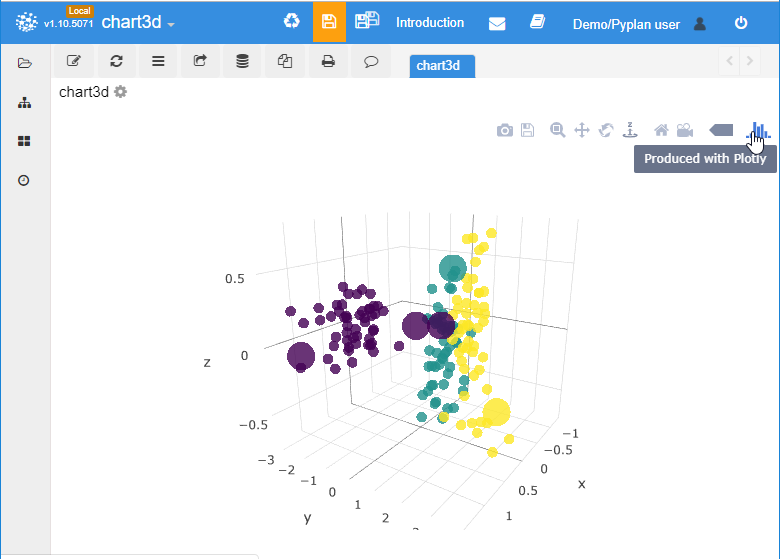
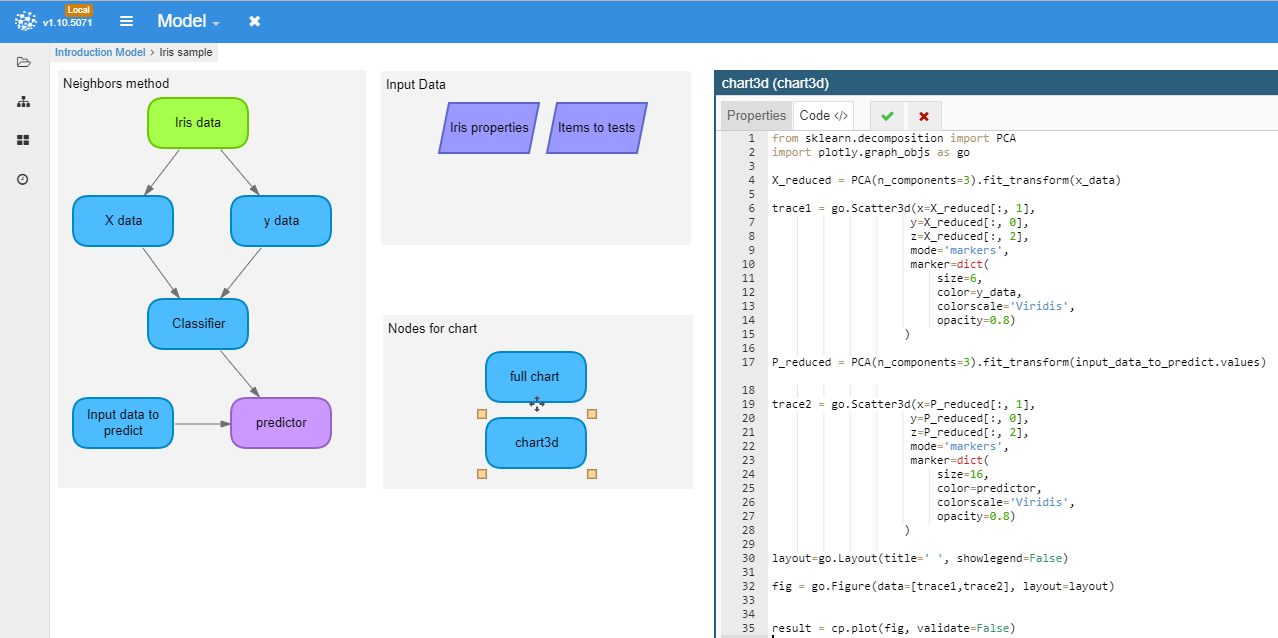 The example above imports Sklearn for machine learning, and the Plotly visualization library in order to render the graph. A Plotly 3D representation is shown in the figure below.
Creating Apps
Apps interfaces can be created by dragging and dropping nodes on an interface design tool.
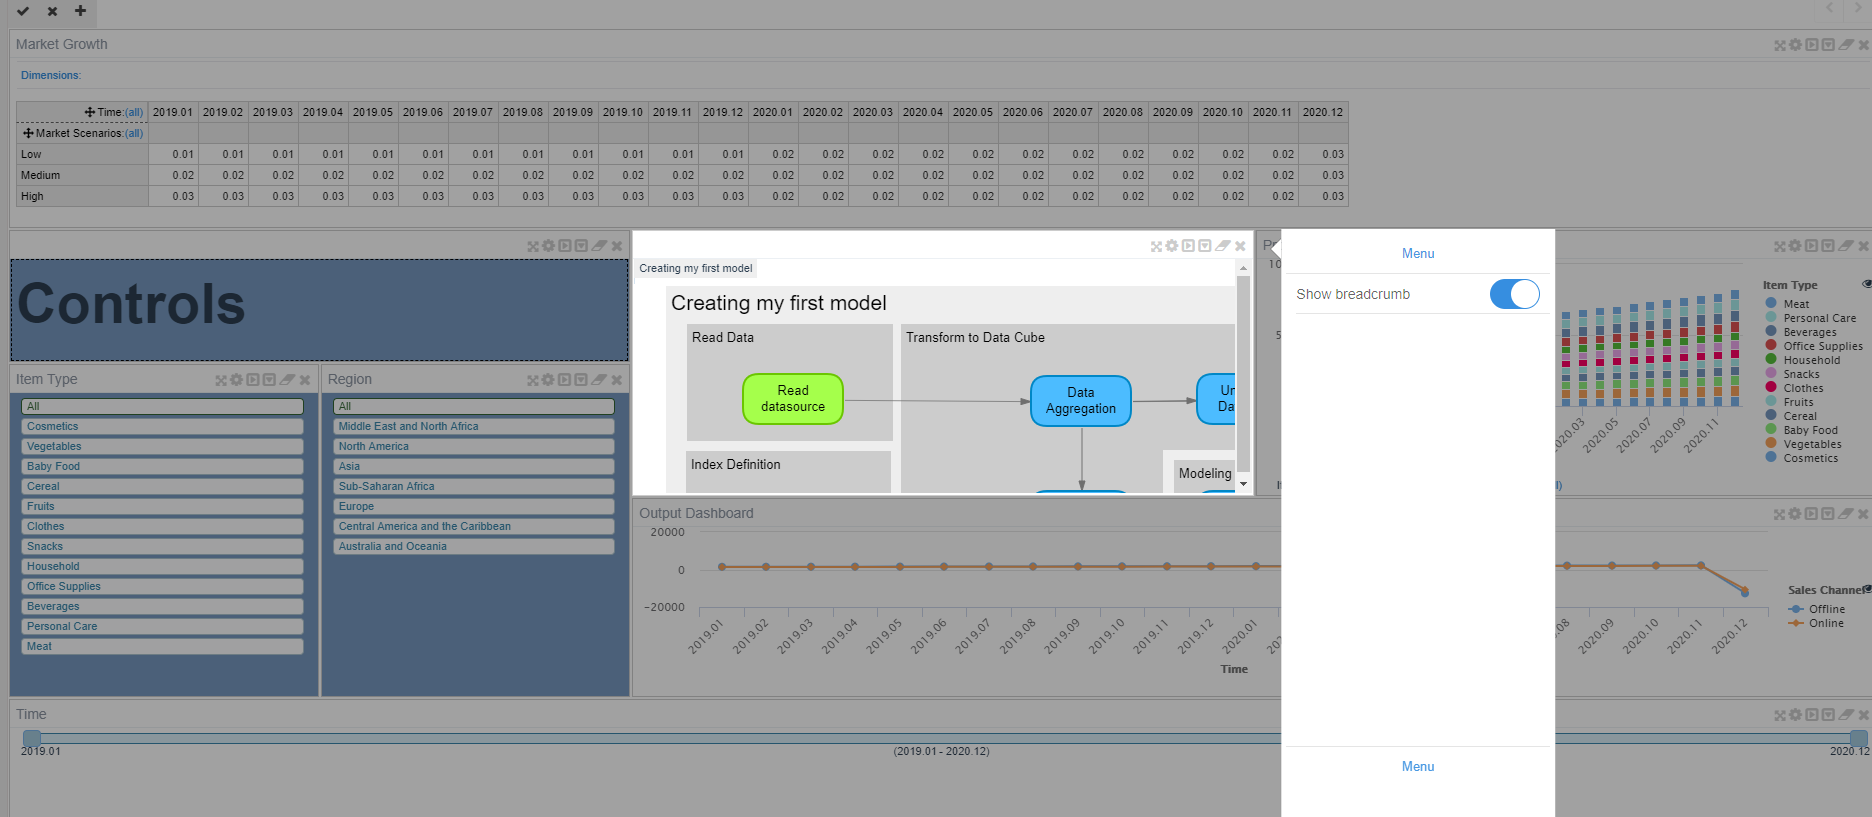
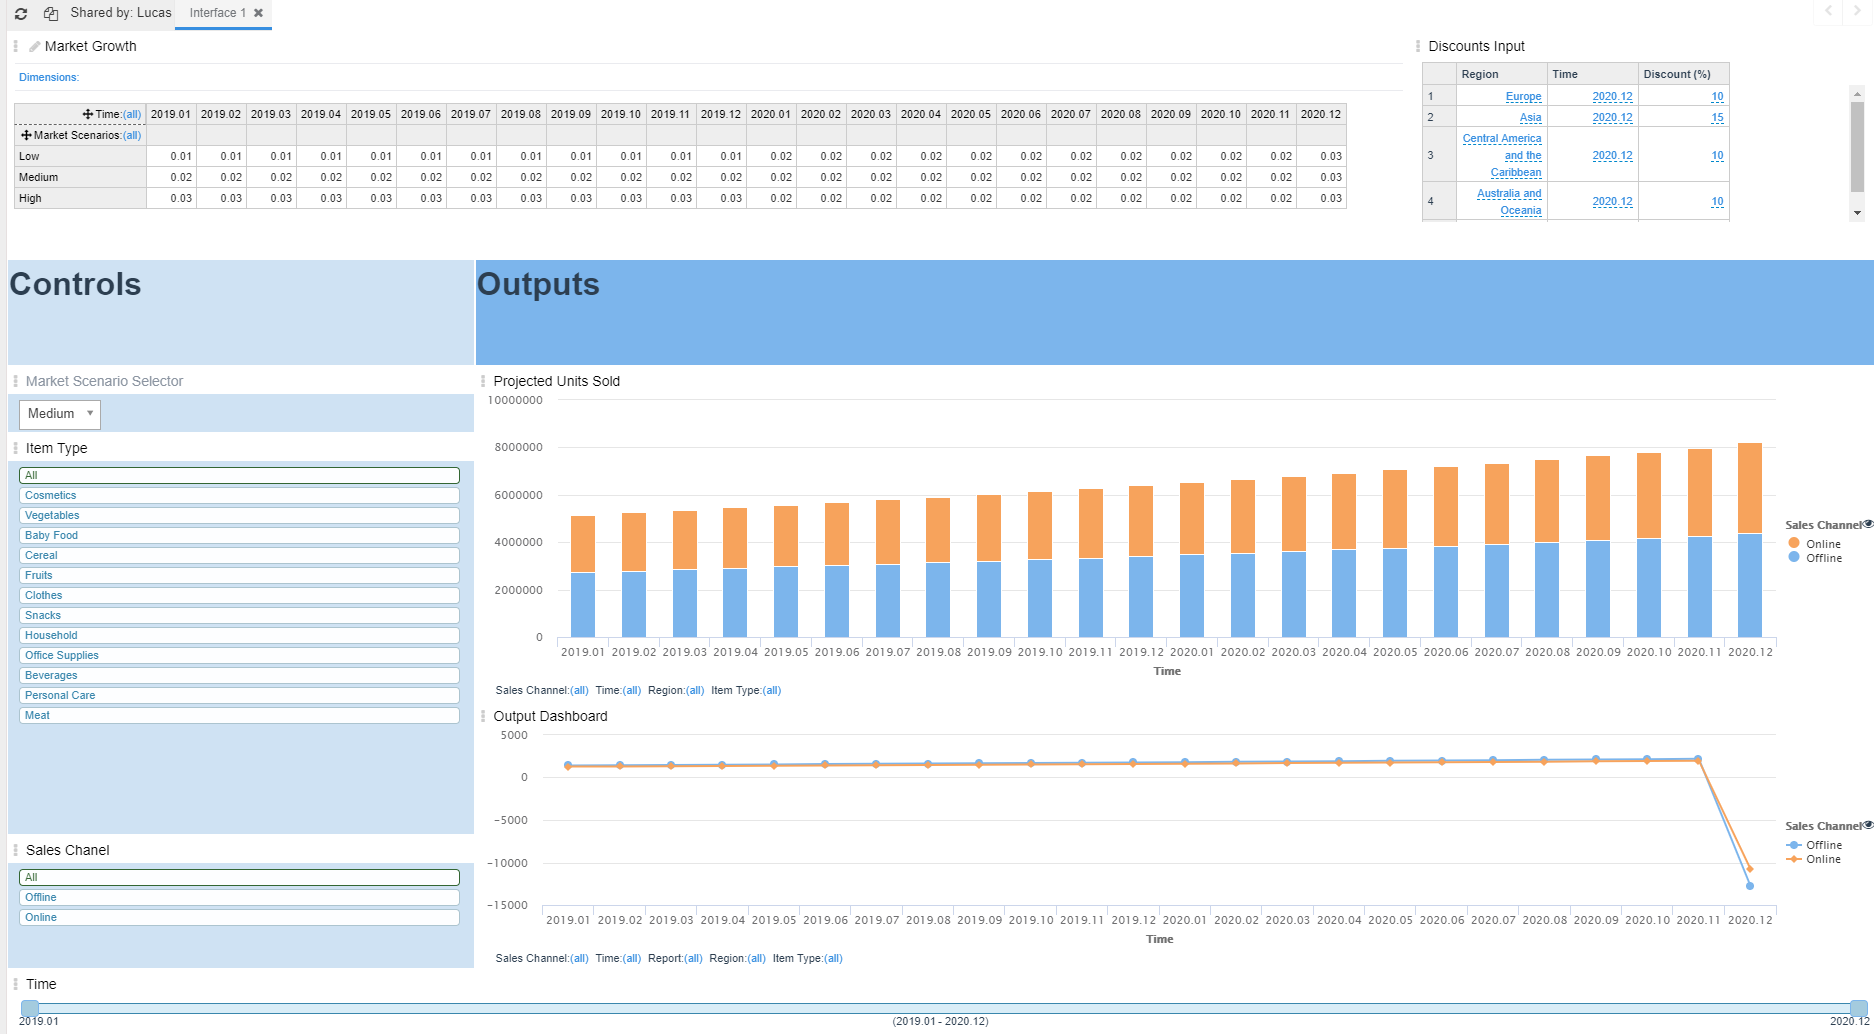
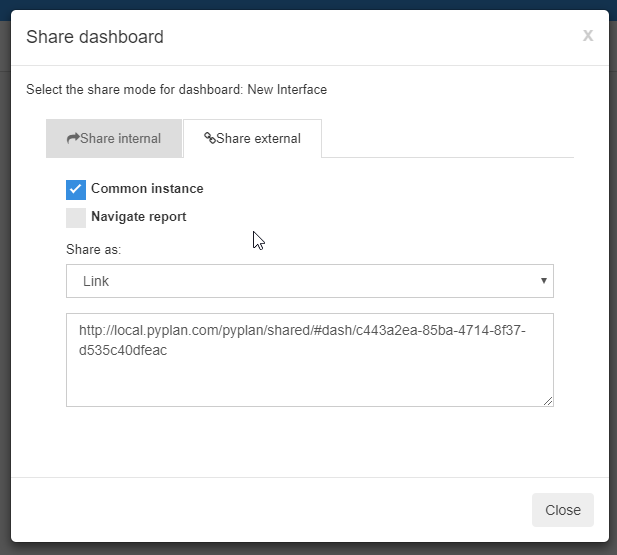
After being created, the app can be shared with anybody, both inside and outside the enterprise environment.
